

Editorial draft
OpenTelemetry Explained: Building an Observability Foundation Without Vendor Lock-in
What OpenTelemetry is, how instrumentation, the Collector and OTLP fit together, and how much vendor portability it really gives you, with a practical adoption path.
By Mark Poulton
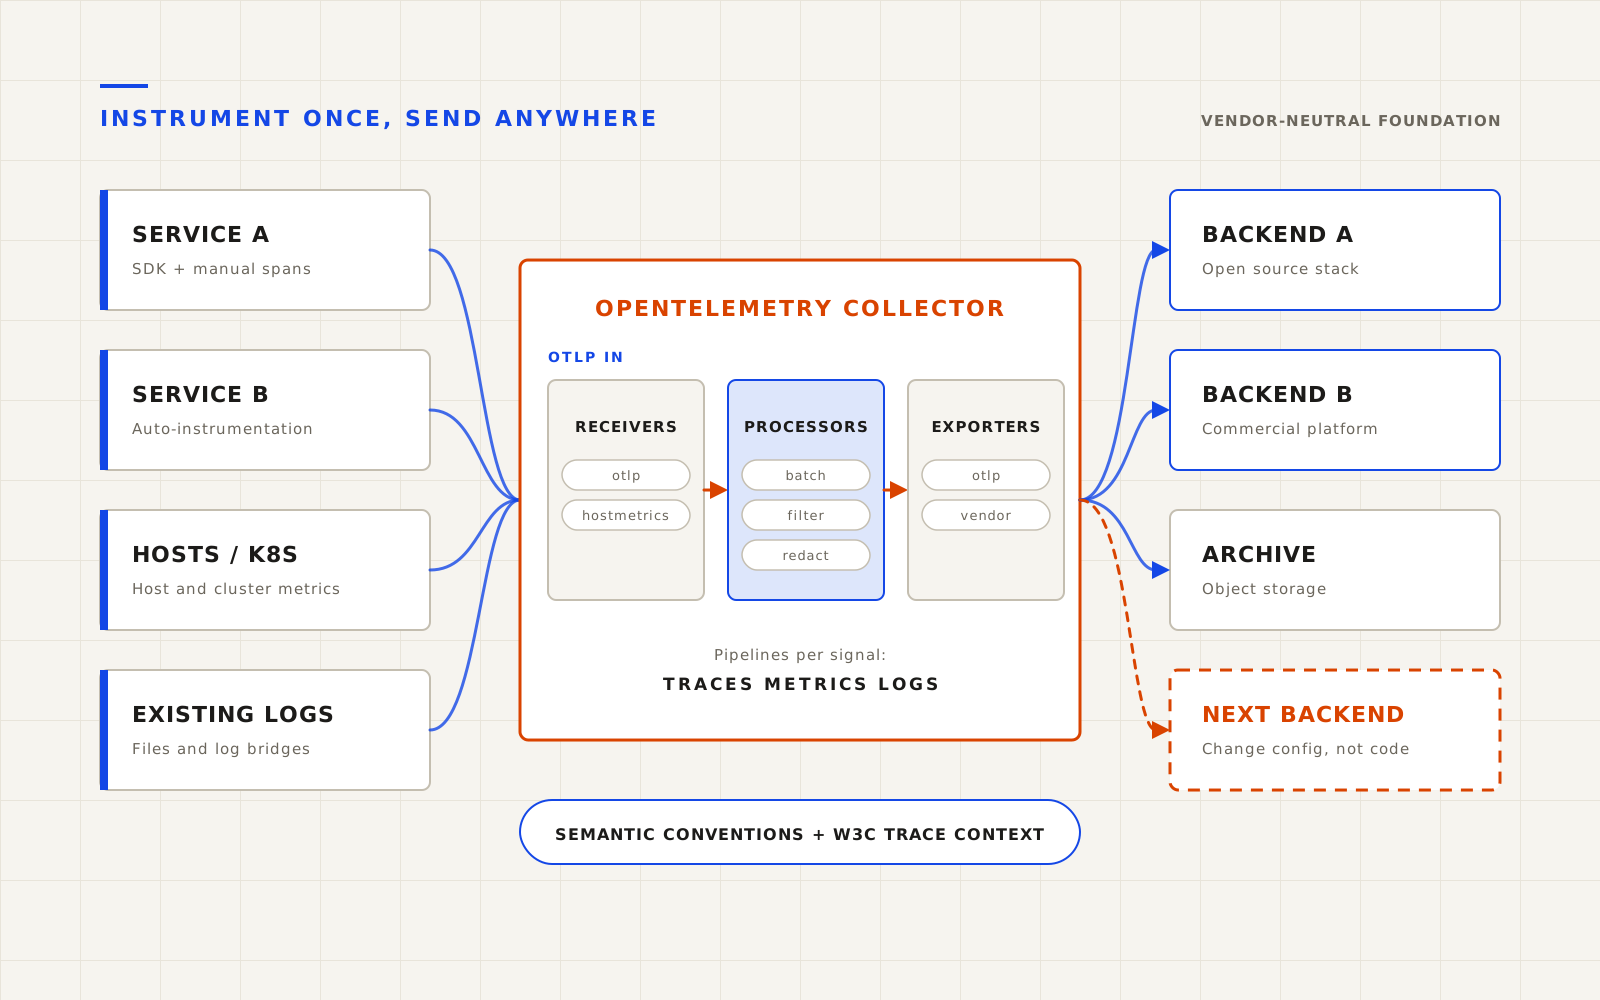
OpenTelemetry is an open source, vendor-neutral standard and toolkit for producing, collecting and exporting telemetry: traces, metrics and logs. It separates how telemetry is generated from where it is stored and analysed. You instrument applications once with OpenTelemetry, send the data through an OpenTelemetry Collector, and choose or change the backend through configuration rather than by re-instrumenting code.
That makes it the most practical foundation for observability today. It does not remove lock-in entirely: dashboards, alert rules, query languages and stored history still belong to whichever backend you use. This article explains the parts, shows how a pipeline fits together, and is specific about what portability you gain. If the signals themselves are new to you, start with logs, metrics and traces explained.
What is OpenTelemetry?
OpenTelemetry (often shortened to OTel) is a Cloud Native Computing Foundation project formed in 2019 by merging two earlier projects, OpenTracing and OpenCensus. It is backed by most major observability vendors and cloud providers, which is a large part of why it has become the default choice for new instrumentation.
It is not a backend. OpenTelemetry does not store data, draw dashboards or send alerts. It defines and implements everything up to the point where telemetry is handed to a system that does.
Its main parts are:
| Component | What it does |
|---|---|
| API | The interfaces code calls to create spans, record metrics and emit logs |
| SDK | The per-language implementation that samples, batches and exports what the API produces |
| Instrumentation libraries | Ready-made instrumentation for common frameworks, HTTP clients, databases and messaging libraries |
| Collector | A standalone service that receives, processes and exports telemetry |
| OTLP | The OpenTelemetry Protocol, the standard wire format for sending telemetry |
| Semantic conventions | Agreed names for common attributes, such as service.name or http.request.method |
The official documentation covers each in depth. The sections below focus on how they fit together.
How does instrumentation work?
Instrumentation is the code that produces telemetry. OpenTelemetry offers two approaches, and most teams use both.
Automatic (zero-code) instrumentation attaches to an application at runtime and instruments supported libraries without code changes. For Java this is an agent added to the JVM start-up command; Python, .NET and Node.js have equivalent mechanisms. It captures incoming and outgoing HTTP requests, database calls and messaging operations, and propagates trace context between services. It is the fastest way to get useful traces.
Manual instrumentation uses the API directly to add spans and attributes that matter to the business: which pricing rule applied, how many items were in a basket, which tenant made the request. Automatic instrumentation sees the plumbing; manual instrumentation explains what the work meant.
Configuration is largely standardised through environment variables, which keeps it out of application code:
OTEL_SERVICE_NAME=inventory
OTEL_RESOURCE_ATTRIBUTES=deployment.environment.name=production,service.version=2.4.1
OTEL_EXPORTER_OTLP_ENDPOINT=http://otel-collector:4318
OTEL_TRACES_SAMPLER=parentbased_traceidratio
OTEL_TRACES_SAMPLER_ARG=0.2
Two details matter more than they appear to. The service name and resource attributes are what let you correlate traces, metrics and logs later, so they should follow an agreed scheme across teams. And the exporter endpoint points at a Collector you control, not directly at a vendor, which is what keeps the backend replaceable.
Logs work differently from traces and metrics. OpenTelemetry does not ask you to replace your logging library. Instead, log bridges connect existing libraries, such as Log4j, Python's logging or Serilog, so their records carry trace and span IDs and can be exported through the same pipeline. The Collector can also read existing log files.
Maturity varies by language and signal. Check the OpenTelemetry status page for the languages you use before committing, as stability levels are version-sensitive and change over time.
What does the OpenTelemetry Collector do?
The Collector is a service that sits between instrumented applications and backends. Applications send telemetry to it; it processes the data and forwards it on. You can run without one, exporting straight from the SDK to a backend, but in most production environments the Collector is where portability and control actually come from.
It is built from pipeline components:
- Receivers accept data. The
otlpreceiver takes data from OpenTelemetry SDKs; others scrape Prometheus endpoints, read log files or collect host metrics. - Processors transform data in flight: batching, filtering, adding or removing attributes, redacting sensitive values, sampling and enforcing memory limits.
- Exporters send data to one or more destinations.
- Connectors join pipelines, for example generating request-rate metrics from spans.
- Extensions add capabilities outside the data path, such as health checks and authentication.
A pipeline wires these together for one signal type. A simple configuration might look like this (this example assumes the contrib distribution, which includes the hostmetrics receiver):
receivers:
  otlp:
    protocols:
      grpc:
        endpoint: 0.0.0.0:4317
      http:
        endpoint: 0.0.0.0:4318
  hostmetrics:
    collection_interval: 60s
    scrapers:
      cpu:
      memory:
      filesystem:

processors:
  memory_limiter:
    check_interval: 1s
    limit_percentage: 80
    spike_limit_percentage: 20
  attributes/redact:
    actions:
      - key: http.request.header.authorization
        action: delete
  batch:

exporters:
  otlphttp/primary:
    endpoint: https://otlp.backend-a.example.com

service:
  pipelines:
    traces:
      receivers: [otlp]
      processors: [memory_limiter, attributes/redact, batch]
      exporters: [otlphttp/primary]
    metrics:
      receivers: [otlp, hostmetrics]
      processors: [memory_limiter, batch]
      exporters: [otlphttp/primary]
    logs:
      receivers: [otlp]
      processors: [memory_limiter, batch]
      exporters: [otlphttp/primary]
Changing backend means changing the exporters block. Sending the same data to two backends during an evaluation means adding a second exporter to the pipeline. No application is redeployed in either case.
Component names and options are version-sensitive, so check the Collector documentation for the release you deploy. The project publishes a minimal core distribution and a larger contrib distribution, and provides a builder tool for assembling a custom distribution that contains only the components you need. A smaller build is easier to patch and has less attack surface.
How should you deploy the Collector?
There are two common patterns, and larger environments tend to use both.
| Pattern | Where it runs | Good for | Trade-off |
|---|---|---|---|
| Agent | Alongside each workload: on each host, as a sidecar or per node | Collecting host metrics and logs, adding local metadata, offloading quickly from apps | Many instances to configure and upgrade |
| Gateway | A central, scalable pool of Collectors | Central policy, redaction, tail sampling, credentials and routing to backends | A critical shared service that must be sized and made resilient |
A common layout is agents on every node that forward to a gateway pool, which holds the backend credentials and applies organisation-wide policy. That keeps vendor configuration in one place, which is exactly where you want it if you later change vendors.
Treat the gateway as production infrastructure. If it falls over, you lose visibility at the moment you are most likely to need it. Monitor the Collectors themselves, set memory limits, and plan for what happens when a backend is unreachable.
What is a telemetry pipeline, and why does it matter?
A telemetry pipeline is the path data takes from source to storage, and the decisions applied along the way. The Collector turns those decisions into configuration you own, rather than settings scattered across agents from different vendors.
Useful pipeline decisions include:
- Cost control. Drop debug logs in production, remove high-cardinality attributes from metrics, and filter out health-check spans that add volume without insight.
- Sampling. Tail sampling in a gateway can keep every error and every slow trace while sampling routine successful requests. It requires all spans of a trace to reach the same Collector instance, which affects how the gateway is load-balanced.
- Data protection. Remove or hash personal data, tokens and credentials before they leave your environment. This is much easier to enforce centrally than in every service.
- Enrichment. Add environment, region, cluster or ownership attributes so telemetry arrives already labelled.
- Routing. Send security-relevant logs to a SIEM, application telemetry to an observability platform and a copy of everything to cheap object storage for retention.
These decisions are where much of the long-term value sits, because they let you change cost, privacy and tooling choices without touching application code.
Does OpenTelemetry eliminate vendor lock-in?
Short answer: it removes the most expensive kind of lock-in, but not all of it.
| Layer | Portable with OpenTelemetry? | Notes |
|---|---|---|
| Instrumentation in application code | Yes | The largest saving: no re-instrumenting services to change vendor |
| Context propagation between services | Yes | Uses the W3C Trace Context standard by default |
| Wire format and collection | Yes | OTLP is widely accepted; the Collector can export to many formats |
| Attribute names | Mostly | Semantic conventions help, but backends may map or display them differently |
| Dashboards, queries and alert rules | No | Usually built in the backend's own query language and format |
| Stored historical data | Rarely | Moving years of history between backends is often impractical |
| Vendor-specific features | No | Such as proprietary analytics, AI features or automatic baselining |
So the honest claim is: OpenTelemetry makes the backend replaceable, not interchangeable. Changing vendor still means rebuilding dashboards and alerts and running both systems in parallel for a while. What it avoids is the slowest, riskiest part: changing code in every service.
Two further cautions:
- Vendor distributions. Many vendors ship their own builds of the SDK or Collector. These are often convenient, but check whether they add proprietary components your configuration then depends on. Keeping to upstream components where practical preserves portability.
- Evolving conventions. Semantic conventions have changed as they stabilised. For example, several HTTP attribute names changed when the HTTP conventions were declared stable, such as
http.methodbecominghttp.request.method. Dashboards built on old names need updating. Pin versions and plan for these migrations.
When is OpenTelemetry the right choice?
OpenTelemetry is a strong default when:
- you run several services, languages or teams and want consistent telemetry
- you expect to change, add or consolidate observability tools
- you want central control over cost, sampling and sensitive data
- you are starting fresh, with no large existing investment in proprietary agents
It may not be worth migrating immediately when:
- a small, stable system is well served by an existing agent and there is no plan to change tools
- the language or framework you rely on has immature OpenTelemetry support for the signal you need
- the team does not yet have capacity to operate Collectors properly
Even then, new services can be instrumented with OpenTelemetry while older ones stay as they are. The Collector can receive several existing formats, which allows a gradual migration rather than a big-bang switch.
How should you adopt OpenTelemetry?
- Agree naming first. Decide service naming, environment values and the required resource attributes before instrumenting anything. This costs little now and a lot later.
- Deploy a Collector, even a single one, and point all SDKs at it rather than at a vendor.
- Start with automatic instrumentation on one important user journey across all the services it touches. Confirm traces join up end to end.
- Connect logs by enabling the log bridge or trace-ID injection for your logging library.
- Add manual spans and attributes where business context would have helped in a recent incident.
- Move policy into the pipeline: redaction, filtering and sampling.
- Measure volume and cost per service before expanding, so growth is a decision rather than a surprise.
For a small-scale way to practise these ideas, a single Collector alongside the containers on a properly managed Docker host is enough to learn the moving parts.
Frequently asked questions
Is OpenTelemetry a replacement for Prometheus, Jaeger or a commercial observability platform?
No. OpenTelemetry produces and transports telemetry; those tools store, query and visualise it. OpenTelemetry can send data to Prometheus-compatible systems, Jaeger and most commercial platforms.
Do I need the OpenTelemetry Collector?
Not strictly: SDKs can export directly to a backend. In production, a Collector is strongly recommended because it centralises configuration, credentials, filtering and routing, and it is what lets you change backends without redeploying applications.
What is OTLP?
OTLP is the OpenTelemetry Protocol, the standard format for transmitting traces, metrics and logs between SDKs, Collectors and backends. It runs over gRPC or HTTP. The OTLP specification defines it.
Does OpenTelemetry add performance overhead?
Yes, some. The SDK does work to create, batch and export telemetry. In most services the overhead is modest, and sampling, batching and avoiding excessive attributes keep it under control. Measure it for latency-sensitive services rather than assuming.
Conclusion
OpenTelemetry is best understood as the plumbing standard for observability. It gives you one way to instrument code, one protocol to move telemetry and one pipeline you control for cost, privacy and routing. That makes your backend a replaceable choice rather than a long-term commitment baked into every service. It does not make dashboards, alerts or historical data portable, so plan for those honestly. Combined with good signal design, as covered in the three pillars of observability, and alerting that people trust, it is a foundation that will outlast any particular tool. For the investment argument behind it, see the business case for full stack observability.