

The Business Case for Full Stack Observability: From IT Cost to Strategic Investment
How to judge whether observability is worth funding: the direct operational benefits, the strategic ones, and a way to build a business case from your own incident data rather than borrowed ROI figures.
By Mark Poulton
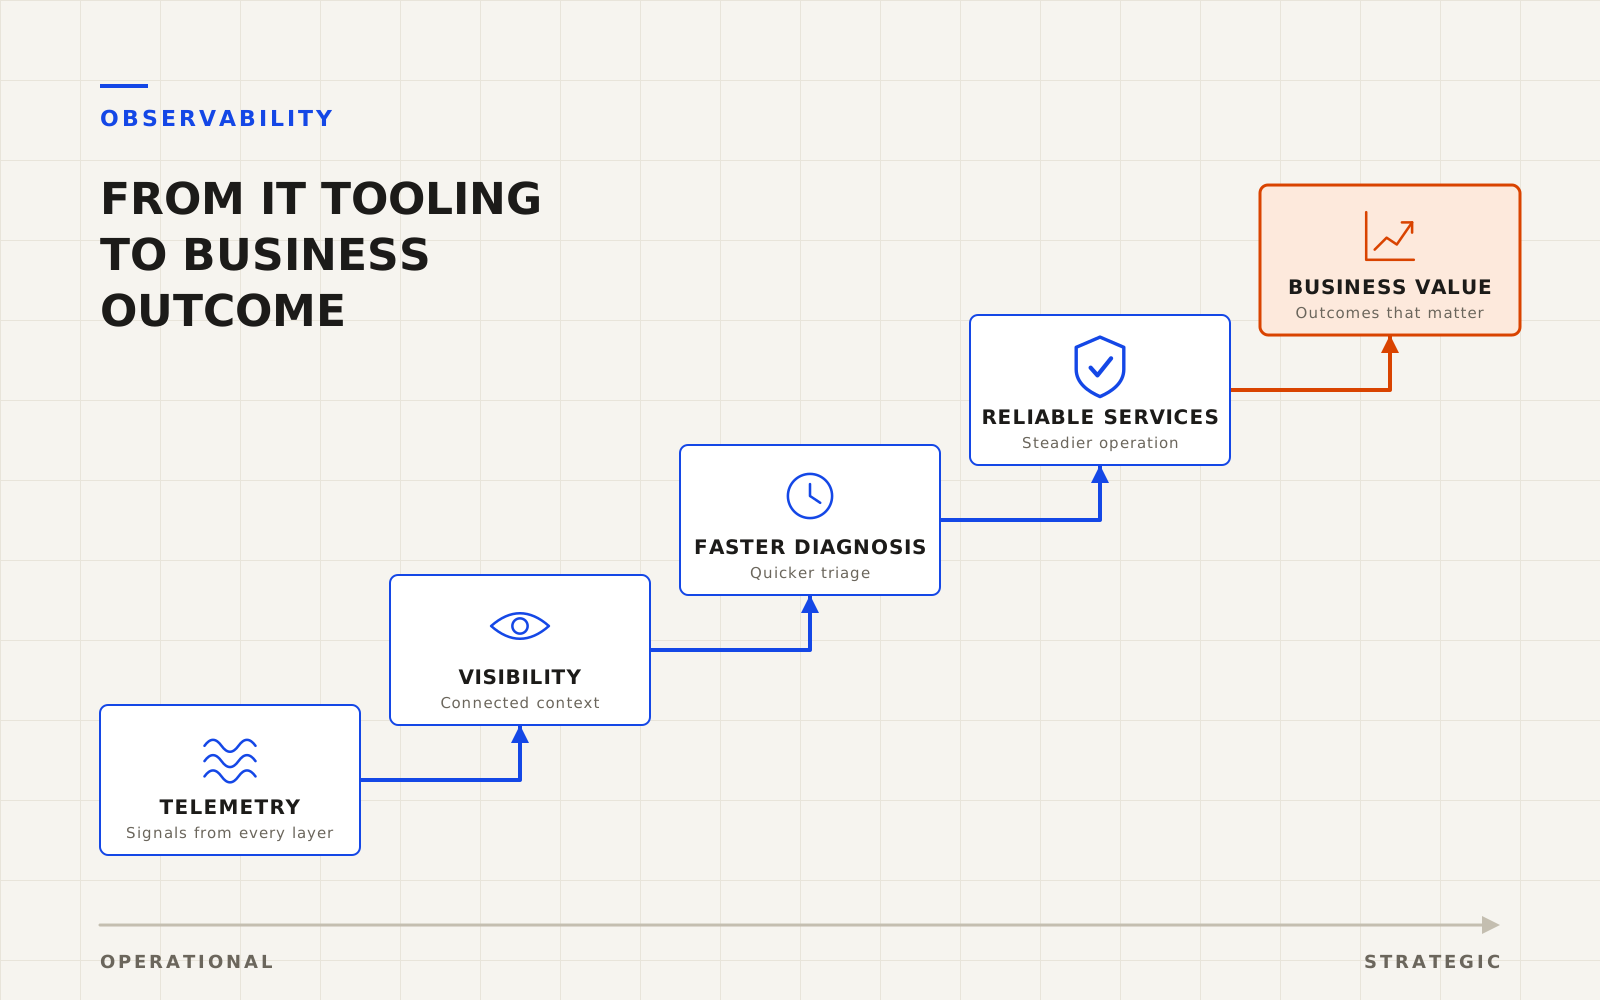
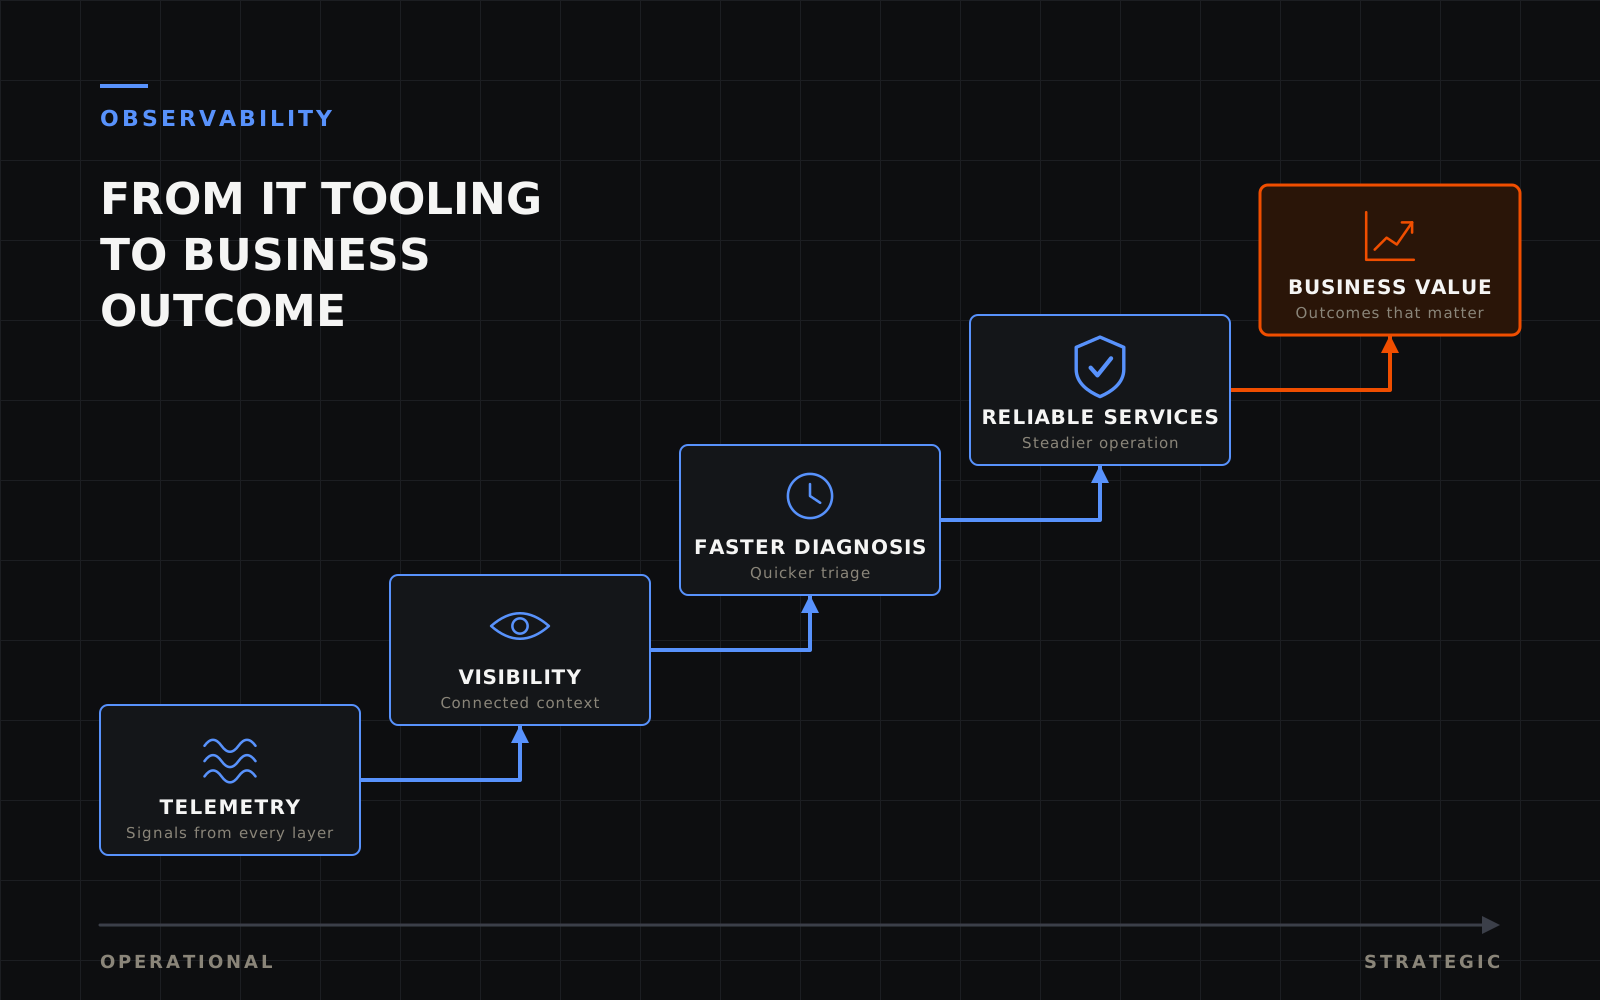
Observability earns its place as an investment when it changes outcomes the business already cares about: how long services are disrupted, how much engineering time goes into firefighting, and how confidently the organisation can change and grow its technology. It is hard to defend as a collection of dashboards, and easy to defend as a capability that reduces uncertainty about how technology is behaving.
This is the business counterpart to Beyond Logs: How Full Stack Observability Transforms Troubleshooting, which explains the operational problem. This article asks why an organisation should pay to solve it, and how to make that case without leaning on borrowed figures.
Why is observability usually treated as a cost?
Costs and benefits are visible in different ways.
- Costs are concrete. Licences or hosting, data ingestion and storage, the effort to instrument systems, training and ongoing tuning all appear in budgets.
- Benefits are diffuse and counterfactual. An outage that lasted twenty minutes instead of two hours does not appear anywhere as a saving. Time that engineers did not spend searching is rarely measured.
- Ownership is split. The people who pay, usually IT or operations, are not always the people who benefit, such as product, customer support and finance.
The result is that observability is often framed as another tool to be minimised, rather than as part of how the organisation runs reliable services. A business case reverses that by making the benefits explicit and tying them to outcomes people already track.
What are the direct and strategic benefits?
It helps to separate benefits that appear soon and can be measured from those that matter over a longer horizon.
| Direct and near-term | Strategic and longer-term |
|---|---|
| Faster identification of the cause of incidents | Ability to scale and change technology with confidence |
| Shorter and less frequent service disruption | Support for cloud and hybrid environments |
| Less manual effort per incident | Higher engineering productivity |
| Fewer people pulled into each incident | More dependable services as a customer promise |
| Better evidence when working with suppliers | Better-informed decisions about architecture and investment |
Direct and near-term benefits
- Faster diagnosis. Connected telemetry shortens the time spent working out what is wrong. This is the most direct effect on mean time to resolution (MTTR), the average time to restore service after an incident. Definitions vary between organisations, so compare like with like.
- Less disruption. Quicker diagnosis and earlier warning of degradation can reduce how long users are affected. Observability does not eliminate failure.
- Reduced operational effort. Fewer escalations, shorter bridge calls and less manual correlation free skilled people for other work.
- Clearer accountability. Evidence that a fault lies in a supplier's service, or in a particular network path, shortens disputes and handoffs.
Strategic benefits
- Operating complexity. As systems grow more distributed, understanding them without good telemetry becomes harder. Observability is part of what keeps complexity manageable.
- Cloud and hybrid confidence. Migrations and new architectures are safer when teams can compare behaviour before and after, and see the effect of a change quickly.
- Engineering productivity. Engineers who can see the effect of their changes spend less time on reproducing problems and more on building. The effect is commonly cited, though it is difficult to attribute to a single cause.
- Service reliability. For many organisations reliability is part of what customers buy. Observability supports the ability to measure and improve it.
- Better decisions. Data on performance, capacity and dependencies informs what to scale, what to retire and where to invest. It also provides evidence when evaluating tools and suppliers.
Where an organisation is investing in distributed networking and security, the same logic applies. Visibility into the network path complements outcome measures such as those described in measuring SD-WAN outcomes.
How do capabilities connect to business outcomes?
Mapping capability to outcome is the core of the case. It forces each claimed benefit to name what changes and how it would be observed.
| Capability | Operational effect | Business outcome | How it could be measured |
|---|---|---|---|
| Correlated logs, metrics and traces | Faster identification of cause | Shorter disruption to customers or staff | Time to identify and resolve, by incident category |
| Alerting tied to user impact | Less noise, earlier notice of degradation | Fewer incidents reaching customers | Alert volume per incident; incidents first reported by users |
| Shared view across teams | Fewer handoffs and escalations | Lower cost per incident | People involved and hours spent per incident |
| Release and change visibility | Faster detection of problems after a change | Safer, more frequent change | Change failure and rollback rates |
| Performance and capacity data | Evidence for scaling and cost decisions | Better-informed investment | Decisions changed or avoided because of the data |
How do you build the case without invented numbers?
Published ROI figures are rarely transferable. They depend on the size of the organisation, the cost of its downtime and how mature its operations already are. A credible case uses the organisation's own data.
- Establish a baseline. From the past year of incidents, record how many there were, how long they lasted, how long diagnosis took, how many people were involved and what services or customers were affected.
- Put a cost on disruption in your terms. Depending on the business this might include lost or delayed transactions, service credits, support contacts, staff time and the cost of workarounds. Avoid industry averages unless you can show they apply.
- Cost the investment fully. Include licences or hosting, data ingestion and retention, instrumentation work, training, tuning, and the cost of tools that overlap and could be retired.
- Model conservative scenarios. Estimate a range of improvement rather than a single figure, and show what must be true for the investment to pay back.
- Separate what is measured from what is judged. Direct effects such as incident duration can be tracked. Strategic effects such as better decisions are real but should be described qualitatively.
- Pilot on a service that matters. Choose a critical service, agree the measures in advance and review the results against the baseline.
A simple structure for the direct benefit is:
Annual benefit = (incidents per year × reduction in disruption per incident × cost of a unit of disruption) + (staff hours recovered × cost of those hours)
Every term should come from your own records. If you cannot fill one in, that is a sign the baseline needs work before the case is presented. As with any outcome measurement, an improvement after a rollout is evidence to examine, not proof that the tool caused it.
When is the case weaker?
A candid case also states where observability will not pay off quickly:
- Simple systems. A small number of components that one person understands may not justify a broad platform.
- No capacity to act. Insight does not help if no one owns the follow-up or changes the way incidents are handled.
- Unmanaged data growth. Telemetry costs can escalate. Without decisions on retention and sampling, the cost can outweigh the benefit.
- Tool sprawl. Adding observability tools on top of existing monitoring without retiring anything increases cost and complexity.
What should different stakeholders ask?
| Stakeholder | Useful questions |
|---|---|
| Technology leaders | Which services are most critical? What is our baseline? Who owns acting on what we learn? |
| Finance | What is the full cost, including data growth? Which existing tools can be retired? |
| Product and customer teams | Which user experiences matter most, and how will we know if they improve? |
| Operations and engineering | Which incidents took longest to diagnose, and what signal was missing? |
Conclusion
Observability is a good example of a technology decision that only makes sense when read alongside business strategy. The strongest case does not rest on a headline ROI figure. It rests on a clear baseline, a transparent cost, a link from capability to outcome, and an honest account of what is measured and what is judged. Used that way, it moves from being treated as an IT expense to being understood as part of how an organisation operates dependable technology at scale.